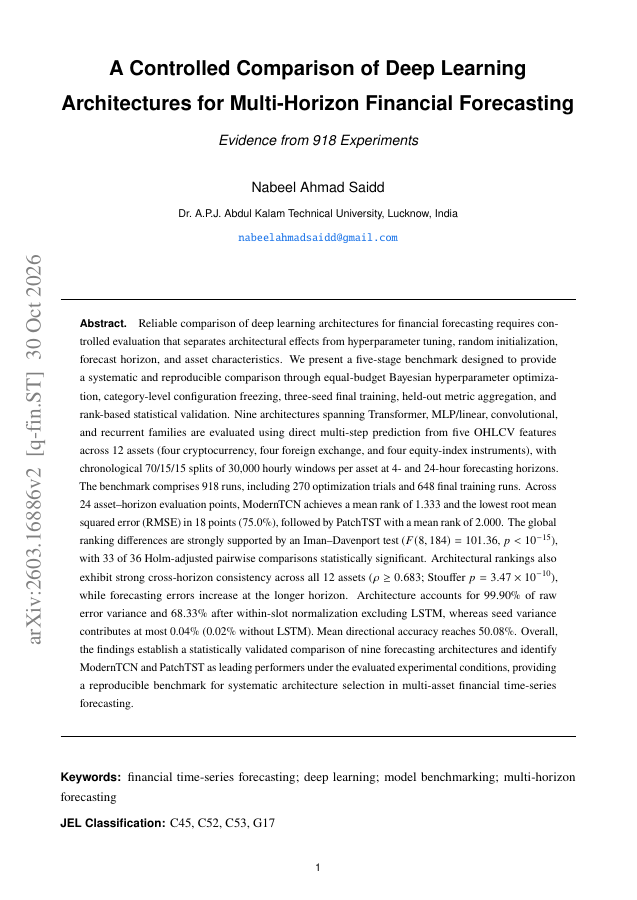
Reliable comparison of deep learning architectures for financial forecasting requires controlled evaluation that separates architectural effects from hyperparameter tuning, random initialization, forecast horizon, and asset characteristics. We present a five-stage benchmark using equal-budget Bayesian hyperparameter optimization, category-level configuration freezing, three-seed final training, held-out metric aggregation, and rank-based statistical validation. Nine architectures from Transformer, MLP/linear, convolutional, and recurrent families are evaluated with direct multi-step prediction from five OHLCV features across 12 assets (four cryptocurrency, four foreign exchange, four equity-index instruments), using chronological 70/15/15 splits of 30,000 hourly windows per asset at 4- and 24-hour horizons. The benchmark includes 918 runs (270 optimization trials, 648 final training runs). Across 24 asset-horizon points, ModernTCN has mean rank 1.333 and the lowest RMSE in 18 points (75.0%), followed by PatchTST (mean rank 2.000). Global ranking differences are strongly supported by an Iman-Davenport test (F(8,184)=101.36, p<1e-15), with 33 of 36 Holm-adjusted pairwise comparisons significant. Rankings are consistent across horizons for all 12 assets (rho>=0.683; Stouffer p=3.47e-10), while errors increase at the longer horizon. Architecture explains 99.90% of raw error variance and 68.33% after within-slot normalization excluding LSTM; seed variance contributes at most 0.04% (0.02% without LSTM). Mean directional accuracy is 50.08%. These findings provide a statistically validated comparison of nine architectures, identify ModernTCN and PatchTST as leading performers under the evaluated conditions, and offer a reproducible benchmark for multi-asset financial time-series forecasting.
A Controlled Comparison of Deep Learning Architectures for Multi-Horizon Financial Forecasting: Evidence from 918 Experiments
Reliable comparison of deep learning architectures for financial forecasting requires controlled evaluation that separates architectural effects from hyperparameter tuning, random initialization, forecast horizon, and asset characteristics.
- Preview
- Year
- 2026
- Hosting
- Full text hostedCC-BY-4.0
Cite
Notes
Only stored in your browser.
Attribution
- Abstract & full text
- arxiv.org/abs/2603.16886CC-BY-4.0
- TL;DR
- Semantic Scholar